Essential
The DISCp4 Essentil test is ideal for defining your basic profile.
The test takes around ten minutes. Its primary objective is to demonstrate, in 25 questions, the DISCp4 model and the main components behind it. Test results include distribution graphs.
We give away 50 tests a day to random participants, free of charge.
Pro
The DISCp4 Pro test goes into greater detail, both about yourself and your co-workers.
It includes up to 50 questions, generating precise and comprehensive profiles. Test results are saved in a database to be reviewed at a later date. They include graphs showing component distribution, strengths and tendencies as well as team graphs.
The DISCp4 Pro test provides access to the team administrator’s page. This allows you to set up tests for colleagues, but also put together and manage teams. You can view both individual and team profiles. Ideal for getting a general feel for the team and adapting your management style!
The administrator can decide whether or not to send test results to co-workers.
White-label
The DISCp4 Diamant Diamond test can be personalized to your specifications.
This test allows you to adapt our product to your own design and to the specific needs of your company.
Please consult our carte blanche page for further information.
Comparative
Choose the test that match your needs
(1) The price indicated corresponds to one DISCp4 credit. One credit is enough for one person to define their profile. Multi-credit packs are also available at a tapering rate. To find out more, simply log in and visit our on-line store.
We offer preferential rates for schools. Contact us to know more and to establish an estimate.
(2) The DISCp4 Pro test allows you to choose the total number of questions.
(3) The DISCp4 Pro test can combine the graphs generated by your results (please see below) with a system of weighted measurements. This system helps adapt the algorithm which calculates profiles according to the specificities of the company (and the team) and thus generates even more detailed and better targeted results. It is one of Profil 4’s unique advantages.
(4) You can see the results of people who have been given the chance to define their profiles. Please consult the group handbook and the invitation handbook to find out more.
This feature is reserved for logged-in members. Sign up for free on our web-site.
Payment by credit card (Visa, MasterCard) and PayPal, protected by Braintree. Secure SSL transactions. Please check you can see a cadenas padlock in the URL bar. Feel free to contact us regarding other forms of payment (bank transfer) or to request a price quote.
Please note that it is not profil4.com’s role to explain your test results. It is up to each user to draw their own conclusions. There is free documentation available on our web-site. If you join a training program, your coach will generally offer to explain things to you.
Individual graphs
Graphs can illustrate personal results.
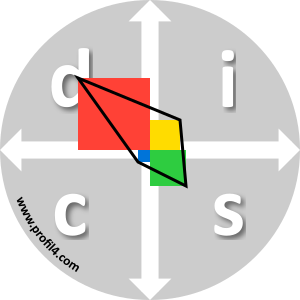
This graph shows the distribution of a profile according to the four components. The sum of the colored surfaces is the specific representation of the profile of the person who performed the test.
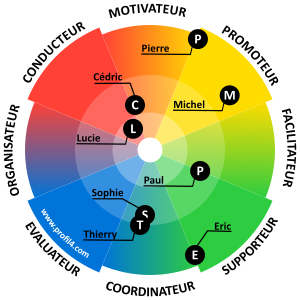
The DISCp4 wheel is composed of four quarters corresponding to the four components.

This graph illustrates both the distribution of the Adapted profile and that of the Natural profile. The surfaces are transparent to highlight the similarities and divergences between the two profiles.

This graph highlights the orientation towards the four components and the axes in one go.
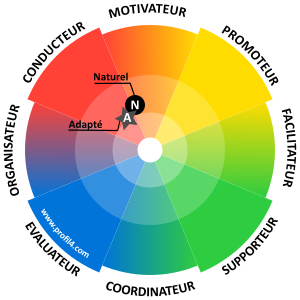
This graph shows where the Adapted and Natural profiles are on the trend wheel.
The trend wheel is composed of eight neighborhoods corresponding to trend families, and concentric discs corresponding to intensity classes.
This graph highlights the differences in intensity.

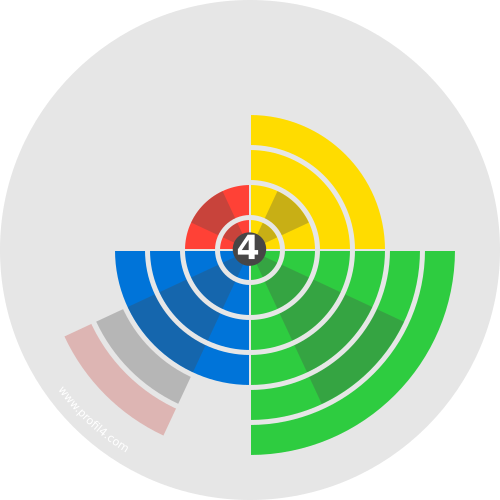
This graph shows the strength (the intensity and not the distribution) of the profile in each of the components.
The values can be represented on the DISCp4 disk and on a bar graph. In this second choice, the shape of the curve serves as a gateway to other analysis models.
Collective graphs
The same graphs can also represent the results of the team.
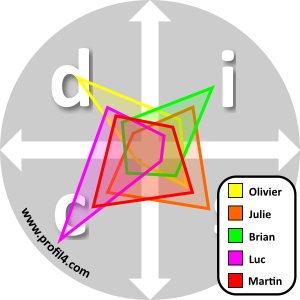
This graph shows how the profiles of the team members are distributed. The surfaces are transparent. The darkest areas correspond to a higher density.

Rapport PDF
Depending on the chosen test, PDF reports can be downloaded.


The simple and effective tool to develop your soft skills.
News
Follow us on our blog and on your favorite social networks.
Quick links
2020 © profil4.com Legal information | Terms of use/sell | RGPD | TCookies | Site map